Every vineyard is unique
Winessense sensors and app help you understand how climate impacts your vines in the present, the past and the future and what you can do about it.
Every vineyard is unique
Winessense sensors and app help you understand how climate impacts your vines in the present, the past and the future and what you can do about it.
SEE
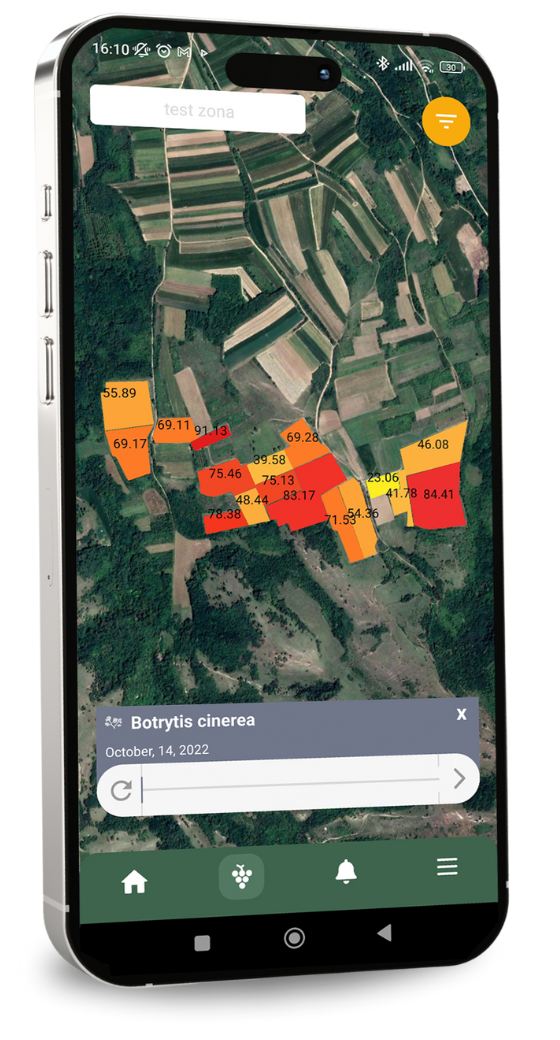
what weather does to your grapes
Using Winessense you can spot:
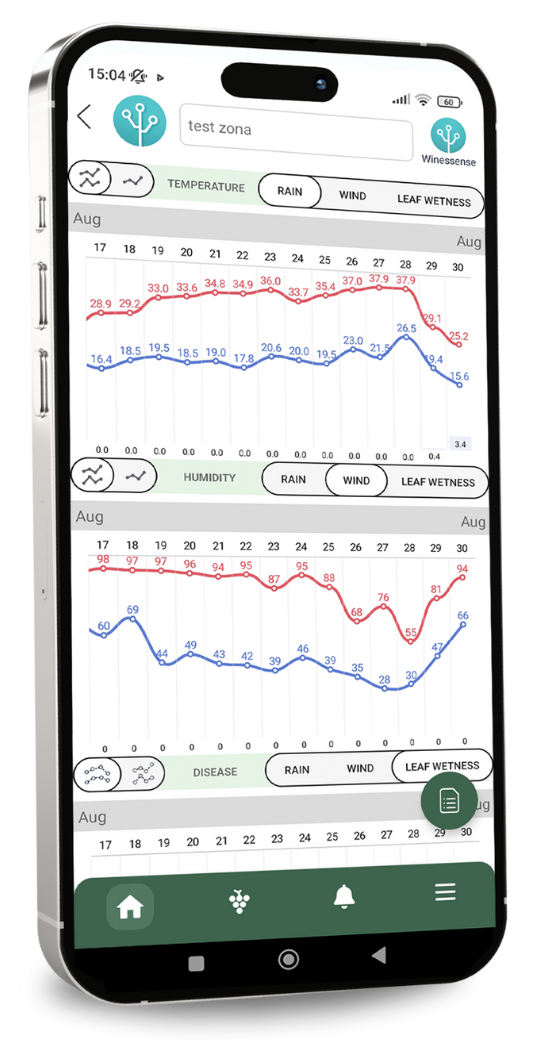
the exact part of a vineyard under a disease pressure
the location, the intesity and duration of frost
the rainfall during vine growth stages
and a lot more …
PREDICT
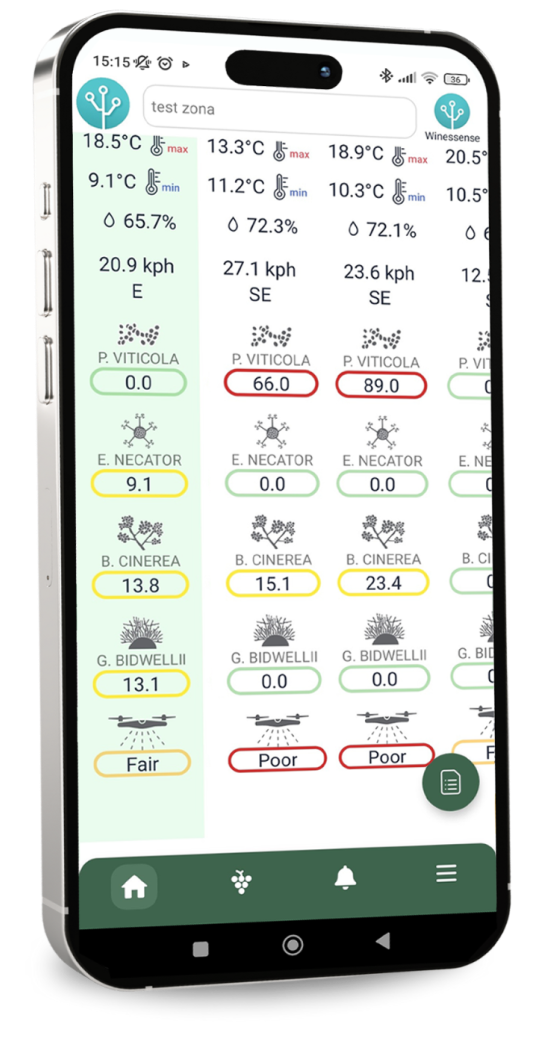
what is about to happen in you vineyards
Winessense will:
send you a message just before the budburst or veraison
visualise the maturity levels on the map
display the weather forecast from a growers perspective
and a lot more …
ACT
where and when is the most needed
Data from Winessense is used:
to plan a vineyard visit where it is the most needed
to decide on the exact spraying time and order
to analyze outcomes of vineyard blocks and the links to weather patterns
and a lot more …

SEE
what weather does to your grapes
Using Winessense you can spot:
the exact part of a vineyard under a disease pressure
the location, the intesity and duration of frost
the rainfall during vine growth stages
and a lot more …

PREDICT
what is about to happen in you vineyards
Winessense will:
send you a message just before the budburst or veraison
visualise the maturity levels on the map
display the weather forecast from a growers perspective
and a lot more …

ACT
where and when is the most needed
Data from Winessense is used:
to plan a vineyard visit where it is the most needed
to decide on the exact spraying time and order
to analyze outcomes of vineyard blocks and the links to weather patterns
and a lot more …
What our users say
their stories — their challenges — their passion

Bosnia & Herzegovina

Serbia
What our users say
their stories — their challenges — their passion


Turn variability into a superpower
winessense makes sure the microclimate data works for you
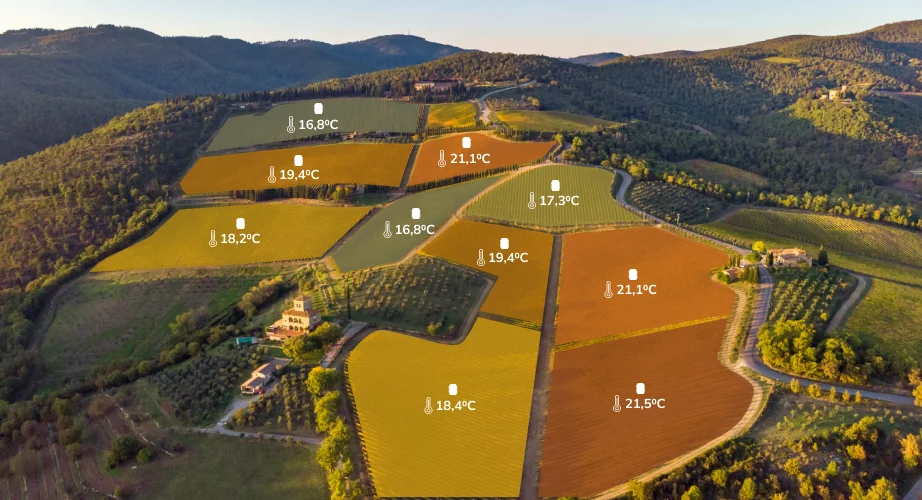
Nature is far from homogenous.
Aerial imaging or single point measurement data provide snippet only. That is why we use continuous multi point in-canopy sensing.
This allows for detailed data collection all the time at the microclimate level from the vine canopy itself. More precise and actionable insights to manage vine health and prevent diseases are now a reality.
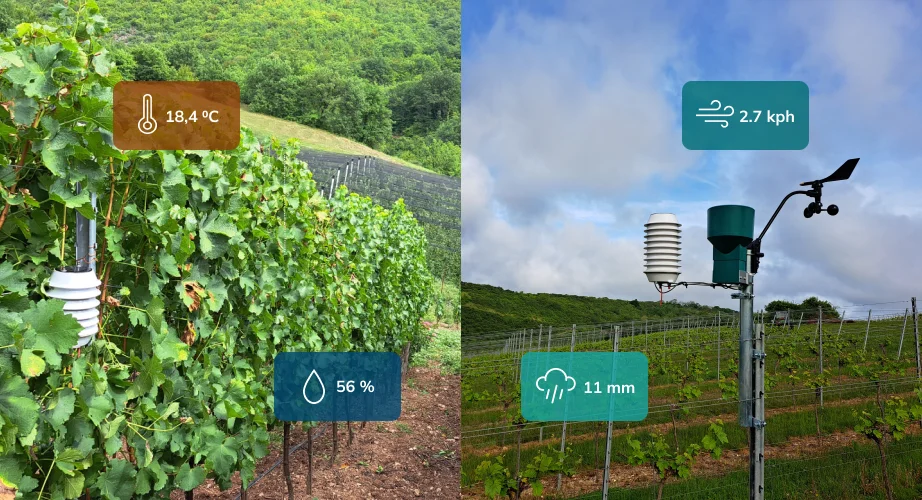
sensors work always using solar power.
Winessense wire-free units are designed to conveniently attach to vineyard posts. They track air temperature and relative air humidity from canopies.
This ensures that all the sensors are seamlessly integrated into your vineyard. Depending on the area, at least one unit measures wind parameters and precipitation.

comprehension of a vineyard redefined.
You get a unique, detailed, picture of climate patterns.
Intuitive vineyard management and analytics from a winegrowers perspective.
Leaf wetness evolution, plant development rates, disease pressures.
Summaries and reports for viticulture.
Eliminating the need for manual calculations, providing effortless data analysis.
everything available through our mobile app.
Decide when someone needs to go to a vineyard and what to look for.
Balance out the spraying options and ensure healthy grapes with minimum inputs.
Select the best harvest time based on the night temperatures.
Record all the actions and generate a detailed chronology of a season for further analyses.
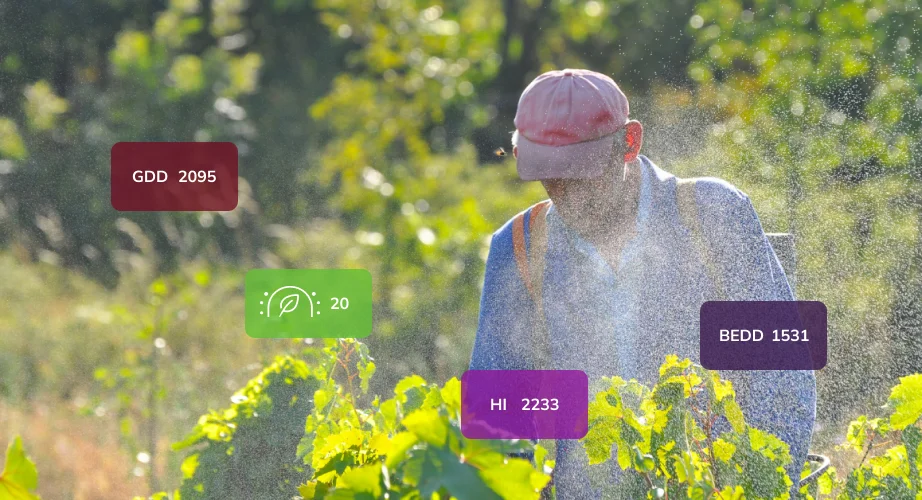
Turn variability into a superpower
winessense makes sure the microclimate data works for you
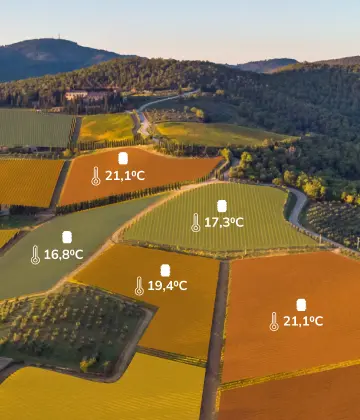
Nature is far from homogenous.
Aerial imaging or single point measurement data provide snippet only. That is why we use continuous multi point in-canopy sensing.
This allows for detailed data collection all the time at the microclimate level from the vine canopy itself. More precise and actionable insights to manage vine health and prevent diseases are now a reality.
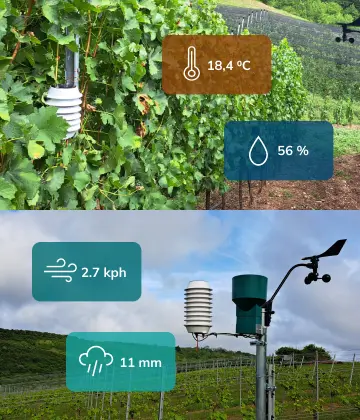
sensors work always using solar power.
Winessense wire-free units are designed to conveniently attach to vineyard posts. They track air temperature and relative air humidity from canopies.
This ensures that all the sensors are seamlessly integrated into your vineyard. Depending on the area, at least one unit measures wind parameters and precipitation.

comprehension of a vineyard redefined.
You get a unique, detailed, picture of climate patterns.
Intuitive vineyard management and analytics from a winegrowers perspective.
Leaf wetness evolution, plant development rates, disease pressures.
Summaries and reports for viticultural practices.
Eliminating the need for manual calculations, providing effortless data analysis.
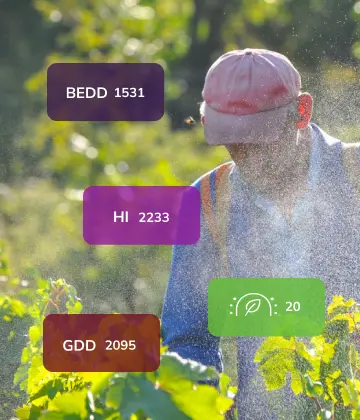
everything available through our mobile app.
Decide when someone needs to go to a vineyard and what to look for.
Balance out the spraying options and ensure healthy grapes with minimum inputs.
Select the best harvest time based on the night temperatures.
Record all the actions and generate a detailed chronology of a season for further analyses.
Turn variability into a superpower
winessense makes sure the microclimate data works for you

Nature is far from homogenous.
Aerial imaging or single point measurement data provide snippet only. That is why we use continuous multi point in-canopy sensing.
This allows for detailed data collection all the time at the microclimate level from the vine canopy itself. More precise and actionable insights to manage vine health and prevent diseases are now a reality.

sensors work always using solar power.
Winessense wire-free units are designed to conveniently attach to vineyard posts. They track air temperature and relative air humidity from canopies.
This ensures that all the sensors are seamlessly integrated into your vineyard. Depending on the area, at least one unit measures wind parameters and precipitation.

comprehension of a vineyard redefined.
You get a unique, detailed, picture of climate patterns.
Intuitive vineyard management and analytics from a winegrowers perspective.
Leaf wetness evolution, plant development rates, disease pressures.
Summaries and reports for viticultural practices.
Eliminating the need for manual calculations, providing effortless data analysis.

everything available through our mobile app.
Decide when someone needs to go to a vineyard and what to look for.
Balance out the spraying options and ensure healthy grapes with minimum inputs.
Select the best harvest time based on the night temperatures.
Record all the actions and generate a detailed chronology of a season for further analyses.
do not miss on a chance to
grow more
sustainably
save hours
in visits
reduce
spraying
wondering how much would it cost?
do not miss on a chance to
grow more sustainably
save hours in visits
reduce spraying
wondering how much would it cost?
read our latest articles
more stories on our blog
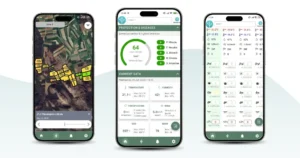
What Is Winessense? The Digital Tool Every Vineyard Needs
Just like fine wine, Winessense has depth and story. But before we explain what it does for every winegrower, let us
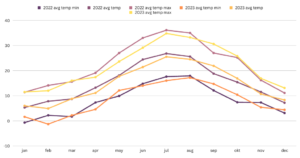
What Makes Every Wine Growing Season Unique?
Growers often explain wine growing season with adjectives as unique, surprising or unexpected. This tells us the weather patterns we all

So This is Winessense in my Vineyard
Winessense is a new generation of vineyard management and analytics systems. The concept of dense in-canopy multi sensing from any and
how to use our app?

meet our amazing team
growing a joint future together

Srđan Tadić
CTO

Vukašin Pejović
CEO & sales

Milan Vukajlović
data scientist
Pavle Vojvodić
backend developer

Anđela Milanović
frontend developer

Miloš Smiljanić
research engineer

Vanja Srbin Nedeljković
graphics & marketing

Dušan Jovičić
frontend developer

Nikola Savić
research engineer

Slobodan Milojević
research engineer

Nataša Marković
finance specialist

Rastko Jokić
research engineer
