Growers often explain wine growing season with adjectives as unique, surprising or unexpected. This tells us the weather patterns we all face in agriculture or during another outdoor activity. Even people that spend less time outdoors have the first person understanding of all of this.
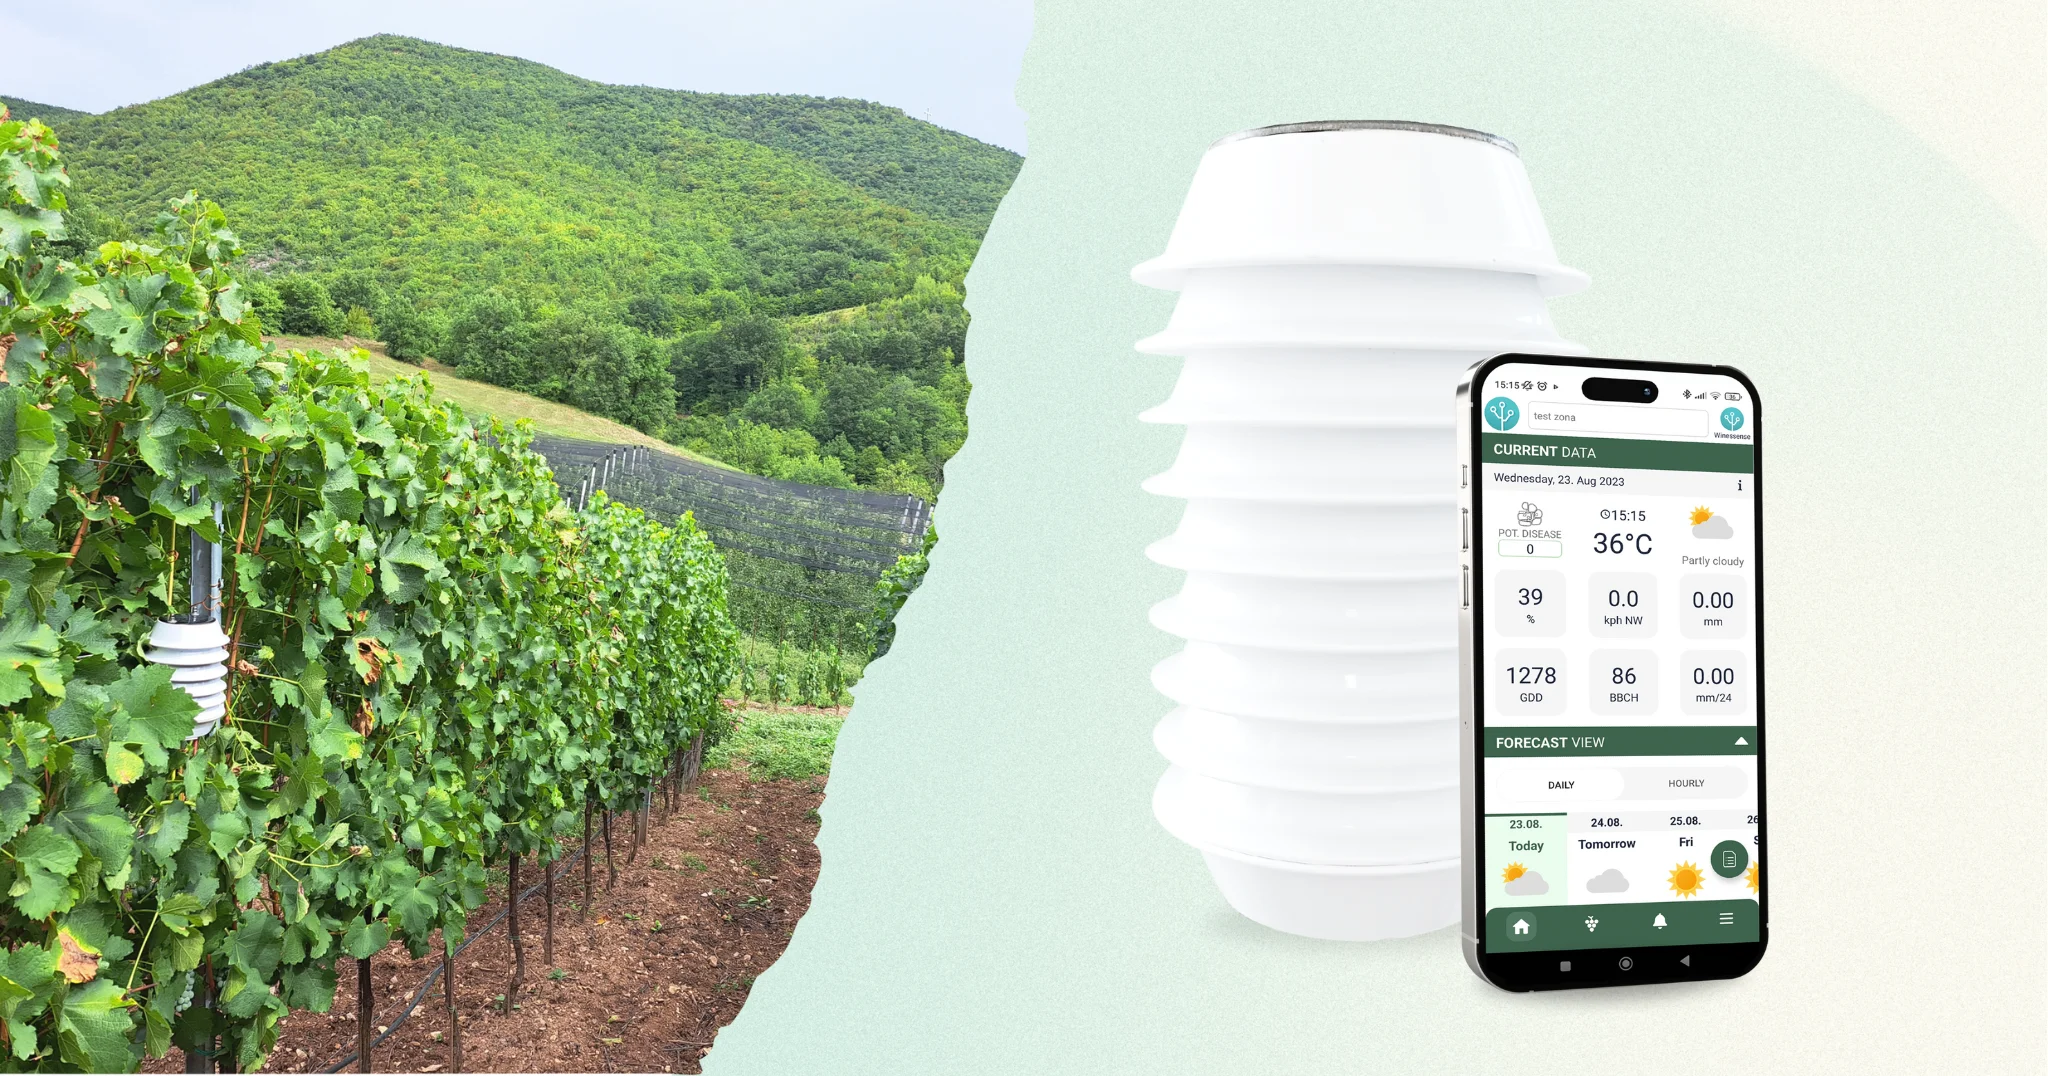
However, with Winessense, the climate awareness tool, we can now classify and quantify what was specific about a growing season. This enables growers to see such difference while it is happening and to use it for their own advantage.
There is, undoubtedly, one thing that is not unique in every wine growing season. Vines always progress with maturity. No matter what. There is no going back. Thus, actions or no actions always reflect themselves in the end result.
The Region of Herzegovina
This region with a long wine growing tradition, is known for an autochthonous star white grape variety: Žilavka. Other important, yet only red, grape varieties are: Syrah, Blatina Vranac and Trnjak.

The World Atlas of wine has a paragraph on this wine region:
“Mountainous Bosnia and Herzegovina was once an important vineyard of Austro-Hungary but now there are just 8650 acres (3500 Ha) of vines, mainly in Herzegovina south of Mostar. Zilavka capable of making memorable full flavoured, dry, apricot-scented white wine, accounts for about half of all plantings, that much more ordinary dark skinned blatina for about 30% ”
Numerous producers have won gold medals in international competitions for mostly Zilavka wines. Some of them are:
- Vinogradi Nuić,
- Carska Vina Grgo Vasilj,
- Podrumi Vukoje,
- Podrumi Andrija,
- and many more.
The wine-growing climate
The climate of the region is roughly Mediterranean, although with a twist. The region, however, is exposed to a significant amount of precipitation.
The average wine growing season temperature varies as a function of micro location. Still, it stays in the range of 16.5-18.5°C. The average rainfall is 1600 mm per square meter or liters per calendar year. While most of the years this stays in the 1350 to 1950 mm range.
Such an amount of water is likely at the higher end of the limit of viticulture. Luckily, most of it is during the off-season. The soils help too. They are light, rocky, and not water holding. Therefore, the vines tend to have just enough water for the full season.
Additionally, the cloud coverage is quite low, rarely above 50 percent of the times. At the same time, the growing season is quite long. Often even longer than 230 days.

The diagrams in here sum up this data for Čitluk. A town in Herzegovina, surrounded by a significant vineyard area.
Vineyard Data for Wine Growing Seasons 2022 and 2023
One component of the uniqueness of a growing season is the specific seasonal weather. No averages are applicable here, whatsoever.
To the purpose of looking at specifics, we have shared some data from vineyards above Čitluk. The data applies to the last two growing seasons, 2023 and 2022.
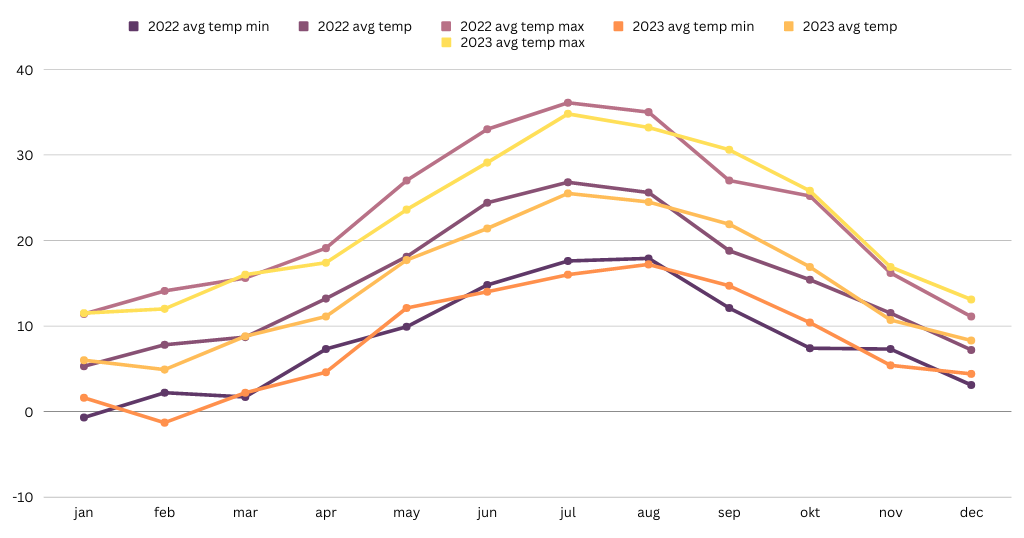

The season of 2022 brought less water and higher temperatures. Whereas, the season of 2023 was on the opposite end of the spectrum, cooler and more humid.
But, when put through a more detailed lens, the year of 2023 was significantly more challenging.
Here are some advanced stats from winessense to illustrate what really happened.
| Parameter | 2022 value | 2023 value |
| Wine growing season temperature [oC] | 17.8 | 16.2 |
| Total rainfall [lit per m2] | 1342 | 1483 |
| Number of days with a potential infection | 48 | 63 |
| Number of days with a severe infection potential | 1 | 5 |
| Longest number of consecutive infection days | 3 | 10 |
| Downy mildew season infection severity | 0 | 573 |
| Powdery mildew season infection severity | 79 | 387 |
The advanced stats are based on the physically measured and calculated micro climate parameters of each wine growing season. Both 2022 and 2023. The micro climate is then interpreted from the disease pressure standpoint. The data, unequivocally shows a significant difference in the challenges during these two seasons. Longest interval of consecutive days with infections is especially important and has caused most of the concern. The growers that have not been able to spot that interval have most likely had significant consequences.
Additional layers of seasonal analysis are achieved when data is interpreted in the context of grape variety and the grape development stages. This opens up a completely new perspective and understanding potential.
The Value Proposition
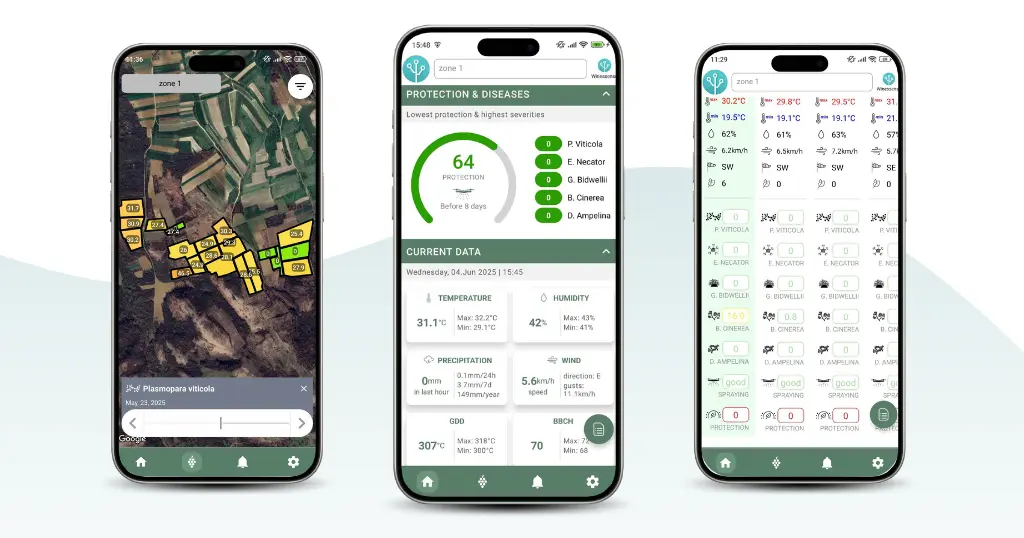
This is a bit of a post-festum summary. However, when this data is available through our:
- Contextual notification stream
- Timed and mapped predictions
- Hourly, what has just happened, graphs
everyone can see the differences right away. Everyone can spot the challenge as it occurs. This helps every grower make sure they are ready to avoid or minimize the impact of the climate puzzles. And all of that right now.