European wine growing is undoubtedly both economically and environmentally an incredibly significant and influential industry. It produces around 60% of the wine grapes in the world, with billions of liters of wine and euros made every year.
Thanks to their lengthy tradition, identifying the best-performing European wine-growing regions is not a difficult task, as it is practically common knowledge. Due to their unique climatic characteristics, these regions are predominantly located in the wider Mediterranean area in the south of Europe and have prevalent characteristics of cooler climates compared to their surrounding areas.
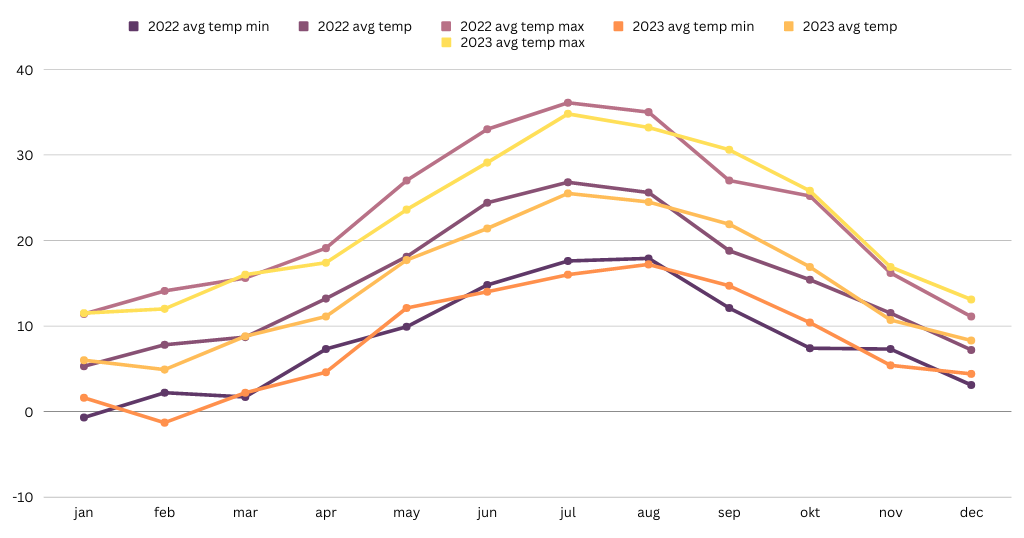
Although all the above are widely known and accepted facts, it is also clear that climate change has had a significant effect on our planet, and is also largely affecting winegrowing. However, rarely do we look back in time to grasp a degree of this change, and it is much easier to understand it if properly visualized. The visual below is made to help us understand the degree of change of bioclimatic indices in major wine-growing areas throughout Europe.
The distribution of BBLI results shown on this map of Europe covers the period between 2011 and 2020 and is animated to highlight the changes throughout the past decade. The darker the red color is, the higher the BBLI value is, and the high values with a value greater than 5.100 show the highest potential risks of disease development in vineyards.
The BBLI results vary dramatically from year to year, especially in cooler parts of the Mediterranean region and in central Europe. Northern countries have also shown to be particularly sensitive, due to low median temperatures.
Still, it is easy to conceive a global temperature rise that can significantly change this picture. The areas with the best conditions might transform into arid and dry ones, while central and western Europe, and even Nordics, could become new high-quality winegrowing areas.
We have used this very powerful index, the hydrothermal index of Branas, Bernon, and Levadoux (also known as BBLI), which is normally used for predictive disease modeling and to visualize climatic changes in a compact way. More details about this index can be found in our previous blog post.
So instead of just qualifying a suitability of a particular region for winegrowing, this index is able to show the climatic dynamics from year to year in a certain area. These clearly visible dynamics show the effects the climate change is having – a much higher degree of variability, leading to higher wine growing risks.
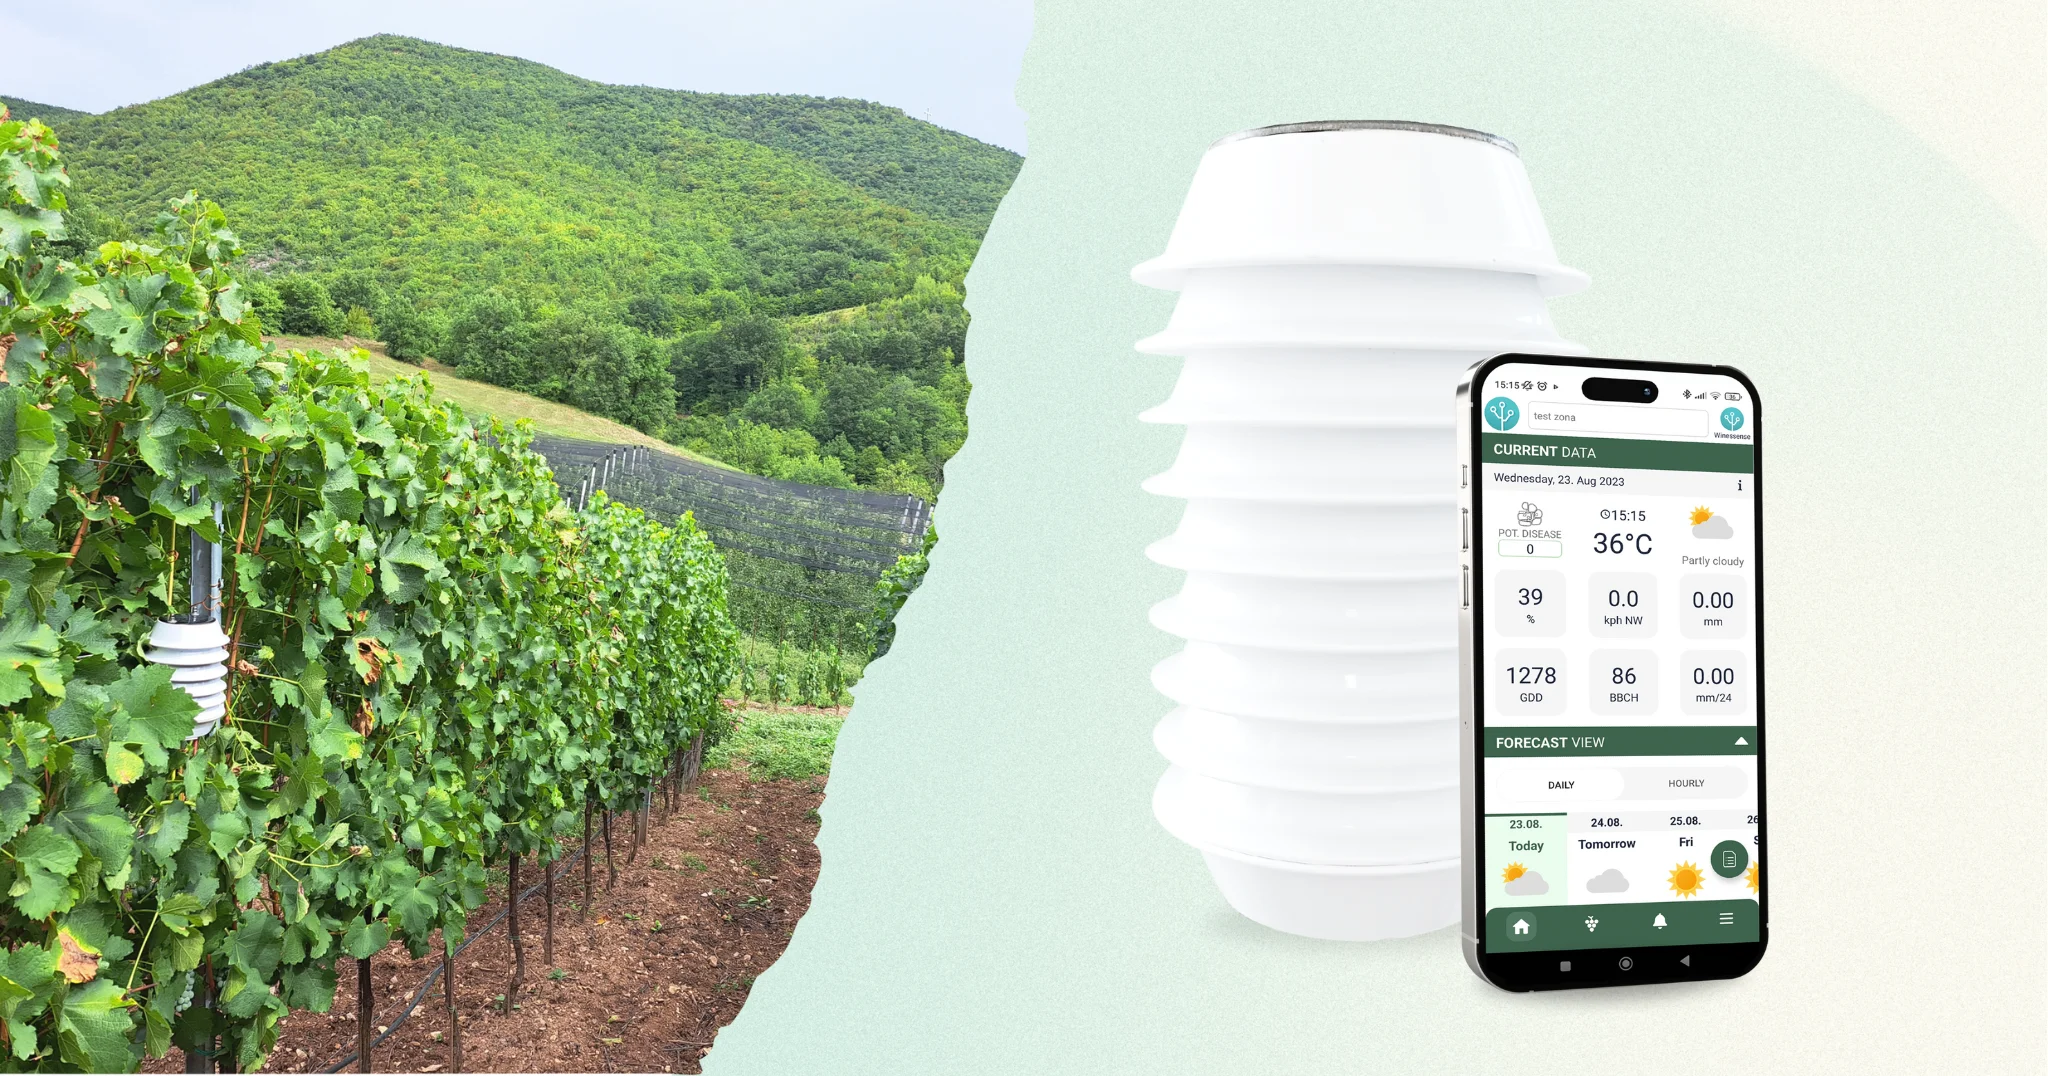
Ultimately, based on the results we see here, it seems that it is going to be quite challenging to rely only on past experiences to deal with new ones. State-of-the-art tools like Winessense are made for winegrowers that want to handle this variability and its effects on their crops while it happens and not after. Knowing the climatic dynamics in close to real-time and its potential impact on one’s vineyards is actually quite possible, reducing the effects of climatic aberrations on winegrowing potential.
Thanks to the modern smart viticulture technology, you can keep track of the conditions on every part of your vineyard in real-time, including bioclimatic indices. Winessense sensor network and vineyard management software monitors the microclimate of each plot, providing precise forecasts and alerts for grape diseases straight to your phone. You can also determine Winkler, Huglin and CNI for every parcel and plan the harvest and an appropriate winemaking process.