Five features ship in the latest Winessense vineyard management software update. All came directly from grower feedback over the past season; three were built with research support from the Horizon Europe Farmtopia project. Here’s what each one does and where it actually saves you time.
European grapevine moth (Lobesia botrana): catch the window, not the flight
Every viticulture professional who has fought Lobesia knows the story. You see the first moths in the trap. You wait. You spray — and somehow the larvae are already inside the berries, where no contact insecticide can reach them. The treatment window for the second and third generations is roughly a week long, and missing it doesn’t just mean a less effective spray. It means the spray is wasted.
The problem isn’t usually pest pressure. It’s timing — and timing depends on temperature, which varies more between vineyards than most regional advisories admit. A south-facing block at 180 m and a valley-floor block 500 m away can be three to five days apart in degree-day accumulation. That’s enough to land on opposite sides of the optimal spray date.
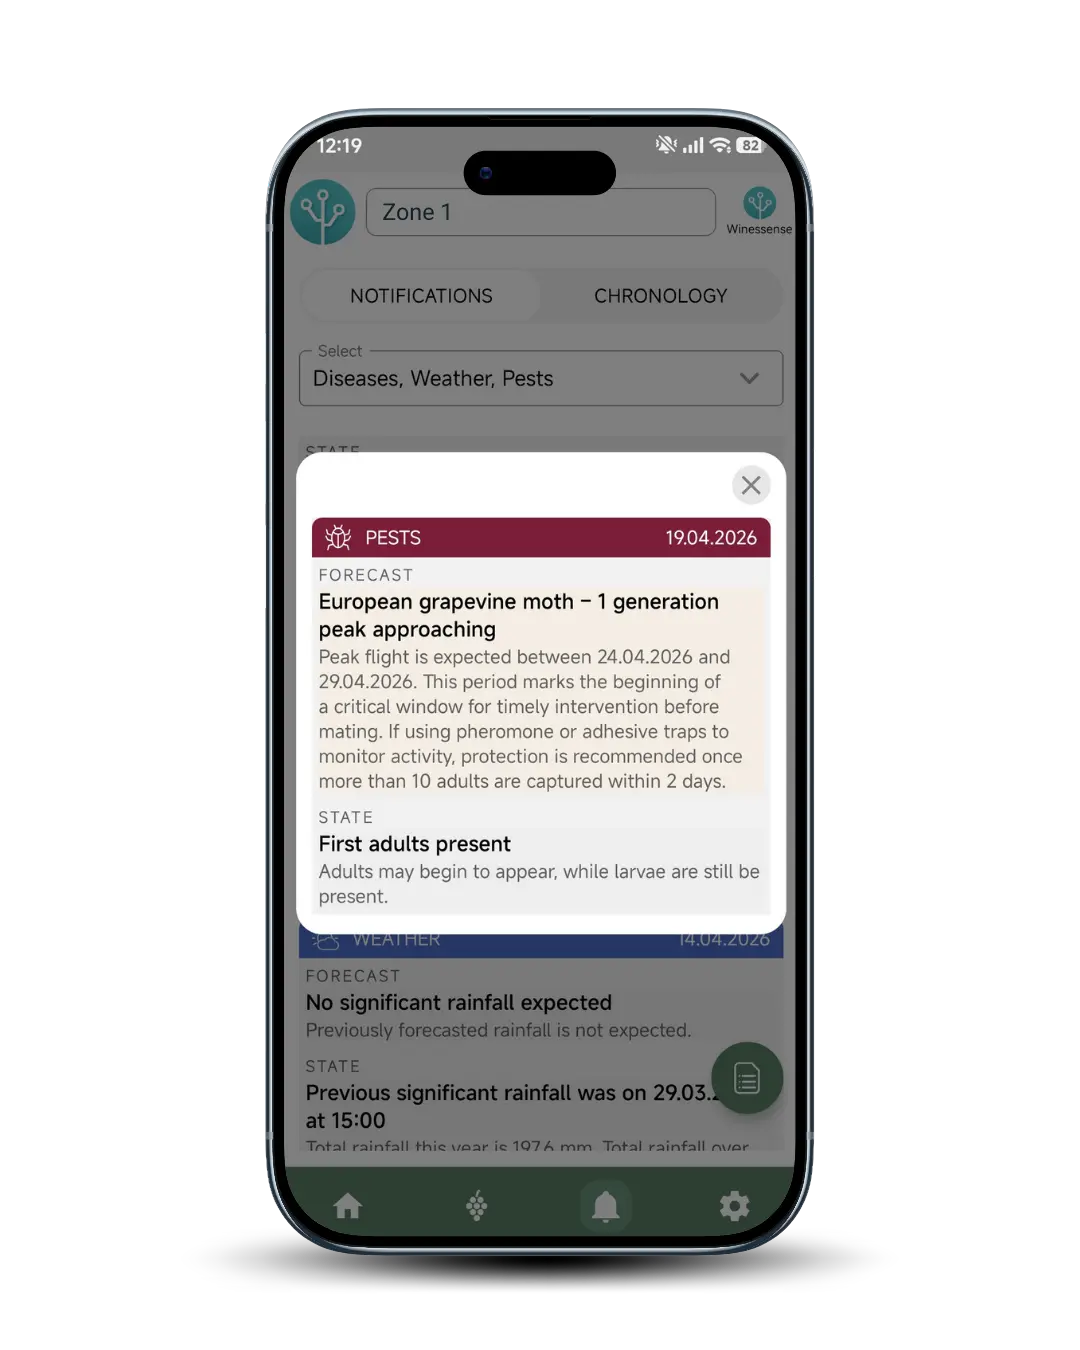
Winessense now models flights generation by generation, using temperature data from your own sensors rather than the nearest weather station. This level of precision agriculture means your grapevine protection decisions are based on what’s actually happening in your blocks — not a regional average. In practice this means:
- you get advance warning a few days before each generation peak, so you scout the right week instead of guessing what week you are in;
- you can compare blocks side-by-side and see which one warms up first — useful when you can’t spray everything on the same day;
- you build a per-block record of when each generation ran, which becomes the baseline for next season.
A dashboard you can actually configure
Most growers check the same three or four things first thing in the morning — last night’s minimum temperature, the 8 day forecast, what’s your current protection level, if you can spray or it’s too windy and so on.. The default Winessense home screen tried to serve everyone, and ended up forcing everyone to scroll.
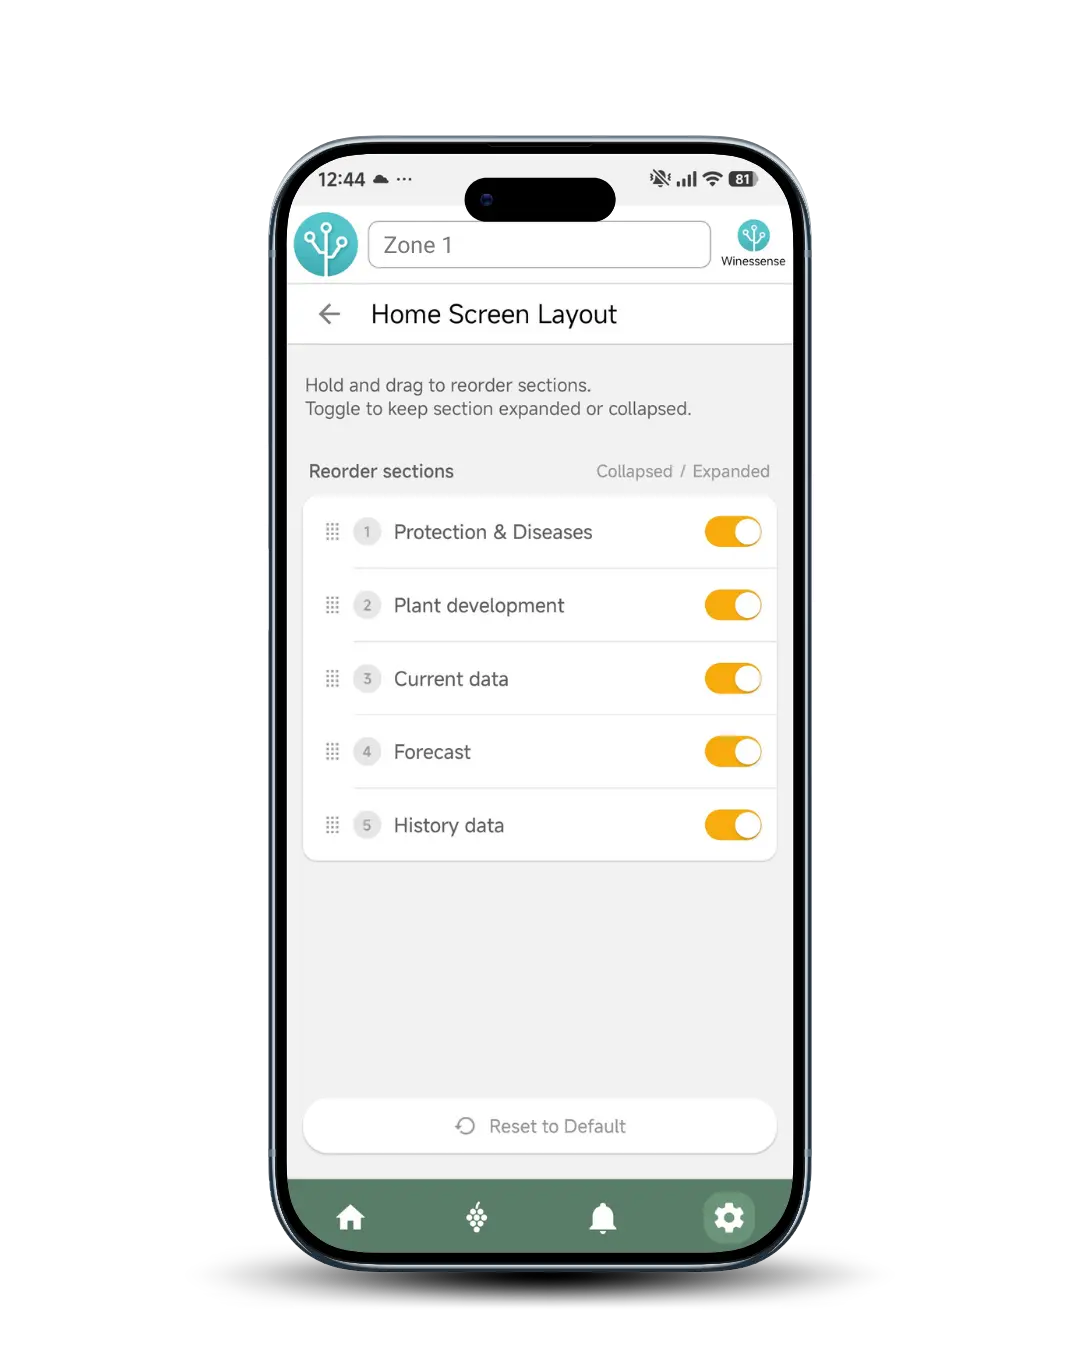
The new dashboard lets you drag the sections you care about to the top, hide the ones you don’t, and reorder the rest.It’s a dashboard you arrange yourself, once. Every time you open the App, matters of your greatest concern and interest are right in front of you.
Photo log: a visual record of the season, in one place
Every time you open the App,, matters of your greatest concern and interest are right in front of you. The problem is that they are undated relative to phenological stage, untagged by block, impossible to find when you actually need them. Six months later, when an agronomist asks “what did the canopy look like at flowering?” or when an insurance adjuster wants documentation of the May hailstorm, you’re scrolling.
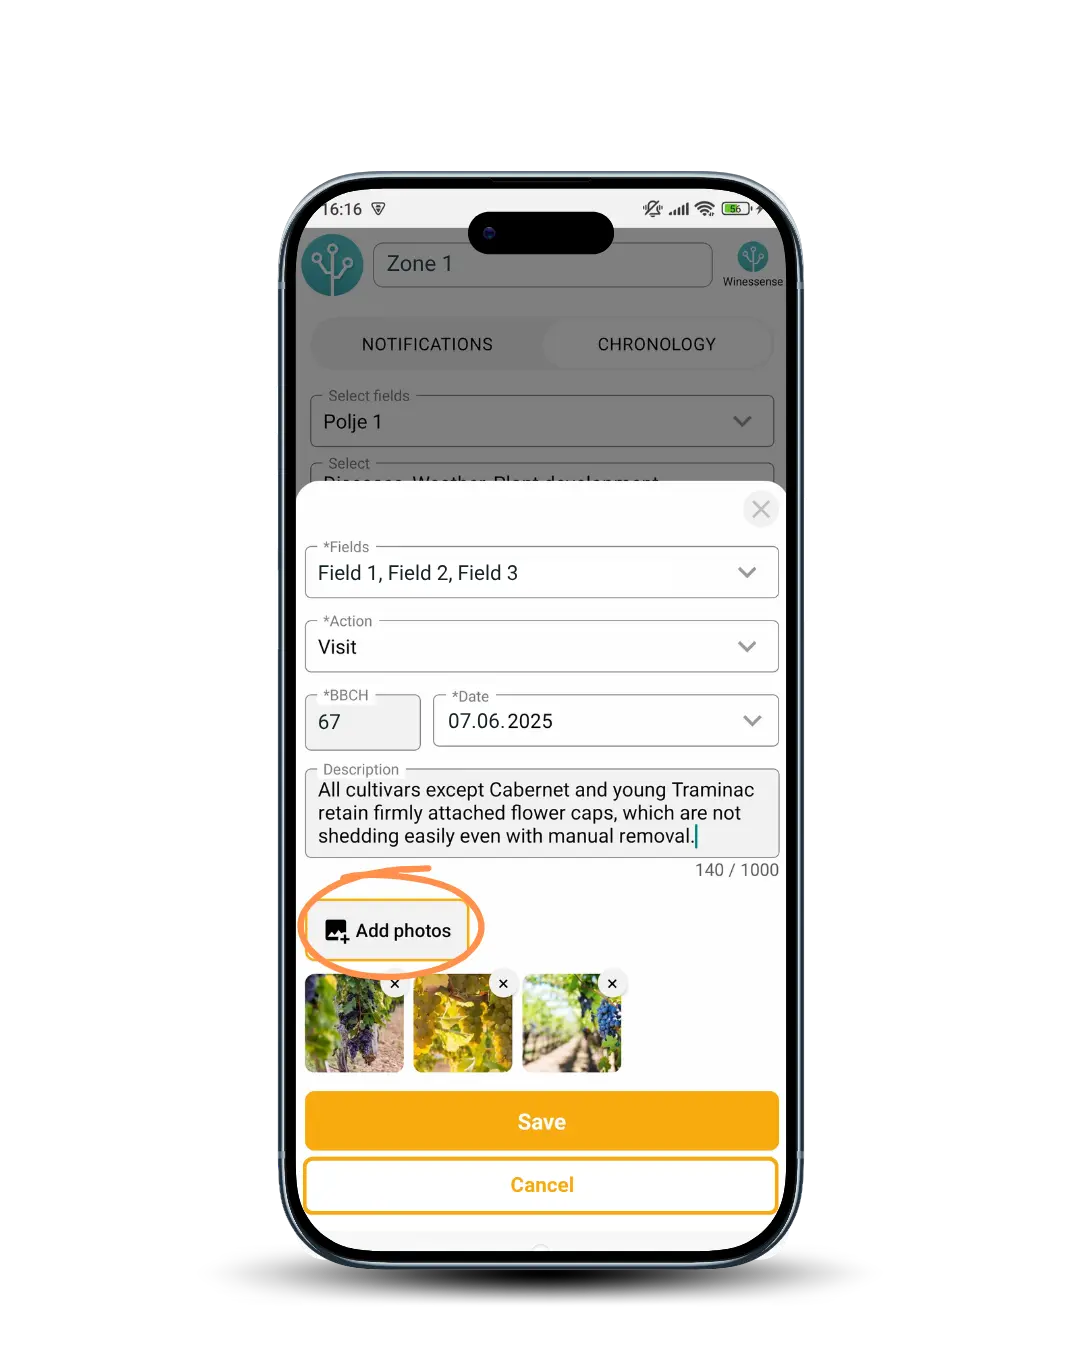
The photo log fixes the filing problem. Each entry attaches to a specific block and date and lets you group multiple images under a single observation, with a free-text note. Typical uses:
- Phenology — bud break, bloom, veraison- You can document your visits and observations regarding grape development
- Disease scouting — potential early disease signs,, , the suspect leaf you photographed before deciding what to do. (after consultation with your agronomist – more in the next section)
- Damage events — hail, frost, wind, equipment: timestamped and tied to a location, which matters if you ever file a claim.
Direct consultations with agronomists
Some decisions — do I spray now, or wait two days? — are faster to outsource than to research. Winessense now lets you send a question to a participating agronomist directly from the vineyard app, with the relevant context attached automatically: your microclimate readings, recent treatment history, current phenological stage, the local forecast, and any photos you’ve logged for the block.
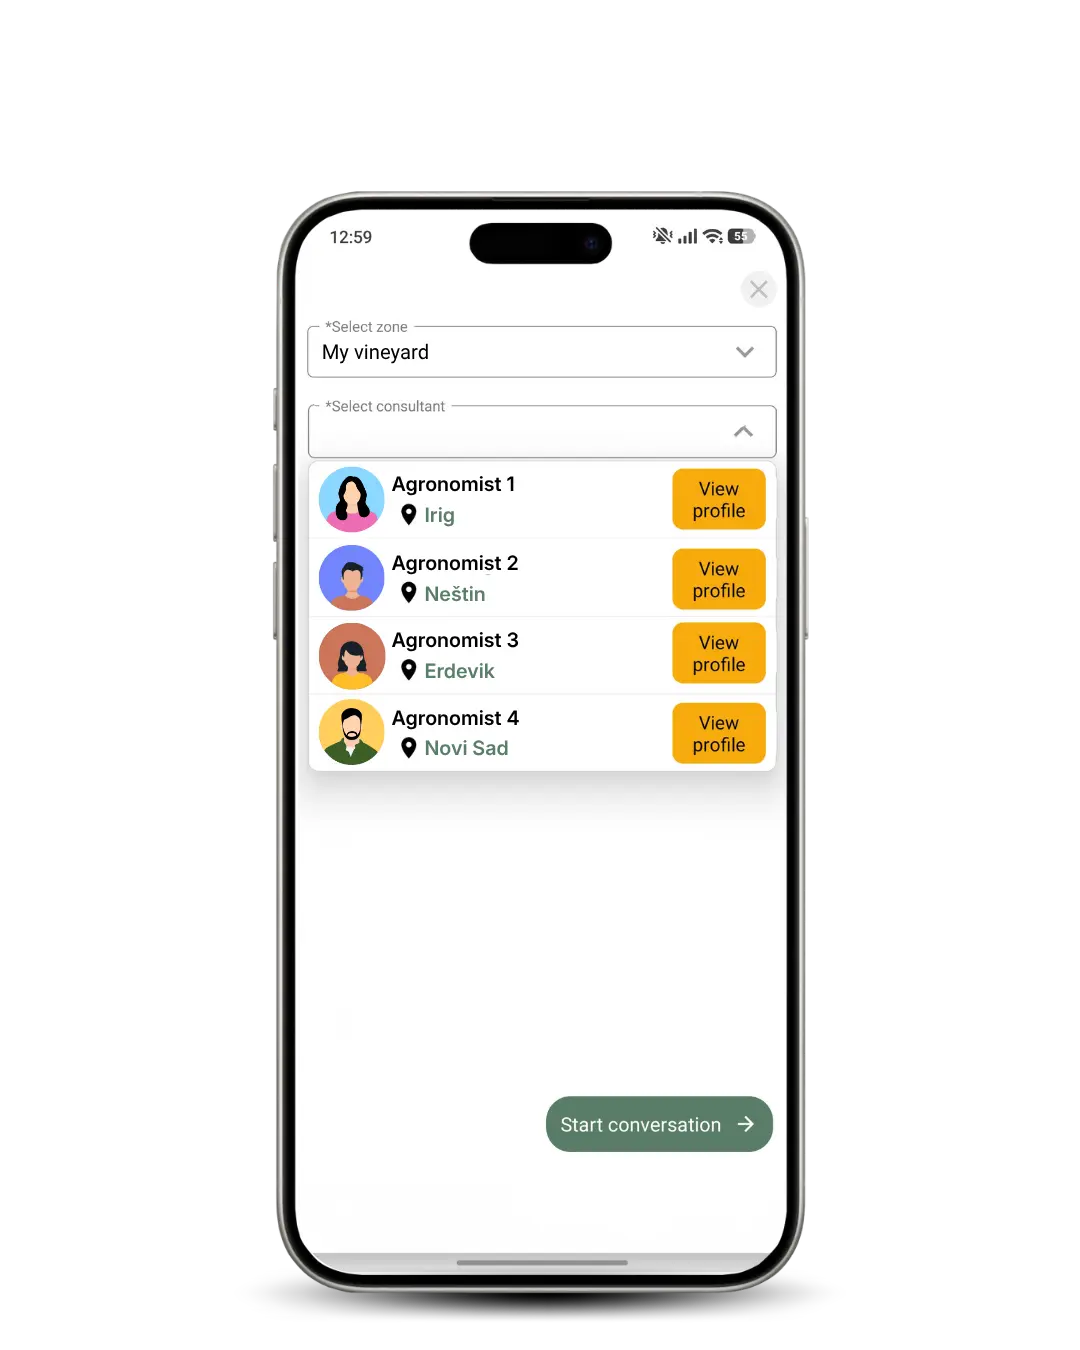
Because the agronomist gets the context with the question, you skip the back-and-forth of “which block?” and “what did you spray last?” Replies arrive in the same thread and stay there, so you have a record of who and when told you what to do. Our agronomists are experienced experts and operate in specific ranges. We are rolling out region by region — get in touch and we will let you know if there are available agronomists in your regeion or notify you when they do.
Spray calculator: get the tank right the first time
One of the most common issues in vineyard protection is incorrect preparation of spray solutions. Too much or too little product can lead to ineffective treatments, unnecessary costs, and avoidable environmental impact.
The new spray calculator helps you get it right every time.
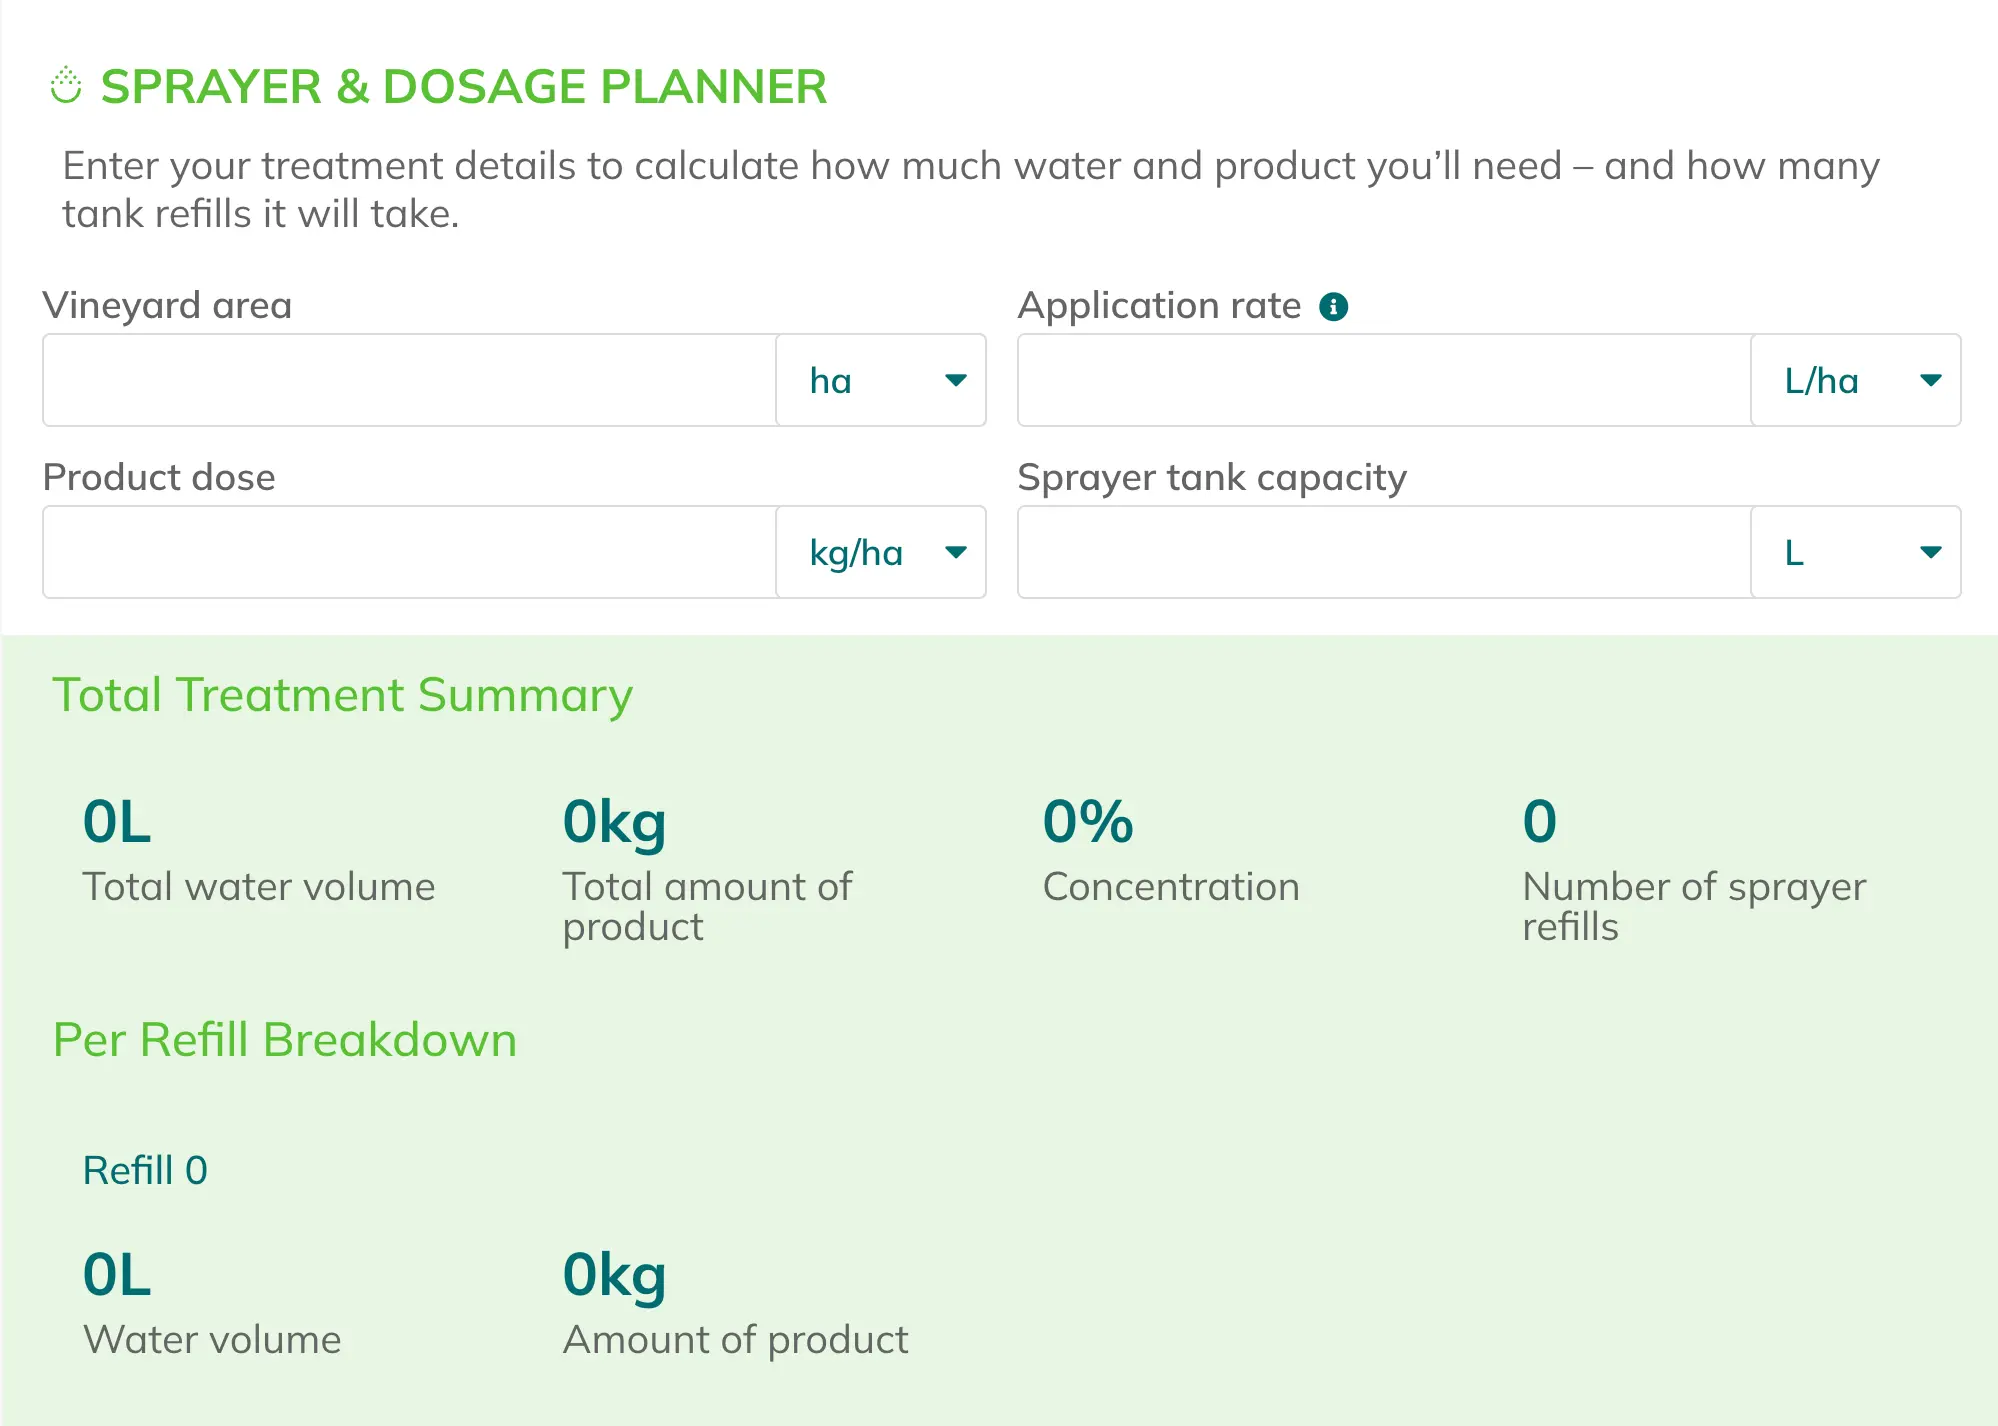
The new spray calculator takes the inputs you’d otherwise do on a notepad – like block surface, product dose and sprayer tank capacity -and returns the tank recipe, the number of refills required, and recommendations for:
- tractor speed
- nozzle count
- flow rate for your target application
The point isn’t that the math is hard — it’s that the math gets done while you’re tired, in fading light, with someone calling about something else. With this feature you can avoid all of these misstakes that quietly costs money through the season and supports sustainable, precise vineyard management practices.
What ties it together
Pest models, microclimate sensors, photo records, agronomist input, and spray math aren’t five separate tools. They’re one decision: what should I do in this block, this week, given what I know? Each feature feeds the others — the photo log makes consultations sharper, the dashboard puts whichever of these matters most today on top, and so on.
This vineyard app is built around the way decisions actually get made in viticulture — block by block, week by week, with real data from your own operation.


The photo log, agronomist consultations, and spray calculator were developed with financial support from the European Union’s Horizon Europe research and innovation programme, as part of the Farmtopia project.


