The wine grapes have been grown for centuries for their unique ability to compress aromas. In countries with long-time winegrowing tradition, the continuity of cultivating and growing grapes has enabled winegrowers to match the best sites with the most suitable varieties. Through time, and trial and error, the winegrowers have managed to find the ideal combination of varieties and areas in which these particular wine grapes grow best.
However, the introduction of new winegrowing geographies, primarily in the New World, has called for the use of more advanced tools, that allow for faster convergence between climate, sites and varieties. These tools are viticultural indices.
Growing Degree Days as the foundation
These indices are used to evaluate the influence of various climate aspects on winegrowing. We have previously looked at the disease pressure measure in the form of BBLI, and in this blog post we evaluate the two growth-related and widely used indices: Winkler Index (WI) and Huglin Index (HI). Both of these are based on the previously discussed measure of energy in the form of growing degree days (GDD), but with specifics applicable to viticulture.
The Winkler Index was first defined in the middle of the 20th century by professors Amerine and Winkler at UC Davis, to be able to classify the climate diversity in California and to match it to wine varieties. It is effectively a GDD summation, or mean temperature summation, during the growing season, with a 50°F (10°C) threshold as a minimum applicable to grapevines. The growing season days for calculating this index are April 1st through October 31st in the northern hemisphere, and October 1st through April 30th in the southern hemisphere.
With this it was possible to average the Winkler index values across seasons to obtain a single value for a specific location. Furthermore, the whole world has been divided into 6 regions, or Winkler zones. Similarly, the varieties could be classified to have certain heat necessities and to belong to a specific region.
Relying on data instead of experience
With the use of the Winkler index the problem of matching locations and varieties was transformed from a long lasting experiment into a simple algebra equation. Of course, as with anything that is first of its kind, the Winkler index was not perfect, and various improvements have been introduced through time.
The most widely used improvement takes into consideration the duration of the day as a function of the location’s latitude. Developed by the French scientist Pierre Huglin, in the late 1970s, the Huglin Index (HI) adds in a multiplication constant that is latitude dependent and has a higher value towards the poles.
This index is also calculated as the GDD during the growing season, with the same threshold as for the Winkler index, but then it is multiplied by the mentioned location-dependent constant. The growing season here is slightly different, from April 1st through September 30th in the northern hemisphere, and from October 1st through March 31st in the southern hemisphere.
Similarly to WI, when averaged across a number of seasons and applied to both varieties and locations a fit becomes obvious. The Huglin Index is seen as likely to gain more importance with climate change becoming a dominant influence. This is as a consequence of a fact that the correction factor it introduces depicts location specifics.
The use of technology can simplify the calculation of indices
These two relatively simple yet powerful tools require a lot of effort daily to be calculated manually throughout the season. It is not realistic to expect from any winegrower or vintner to spend time determining the exact temperature maximums and minimums and keep a track of these valuable indexes amongst all the other field activities. Thus the only convenient and realistic solution is to fully automate this process, based on the temperatures automatically measured at the locations of the vineyards.
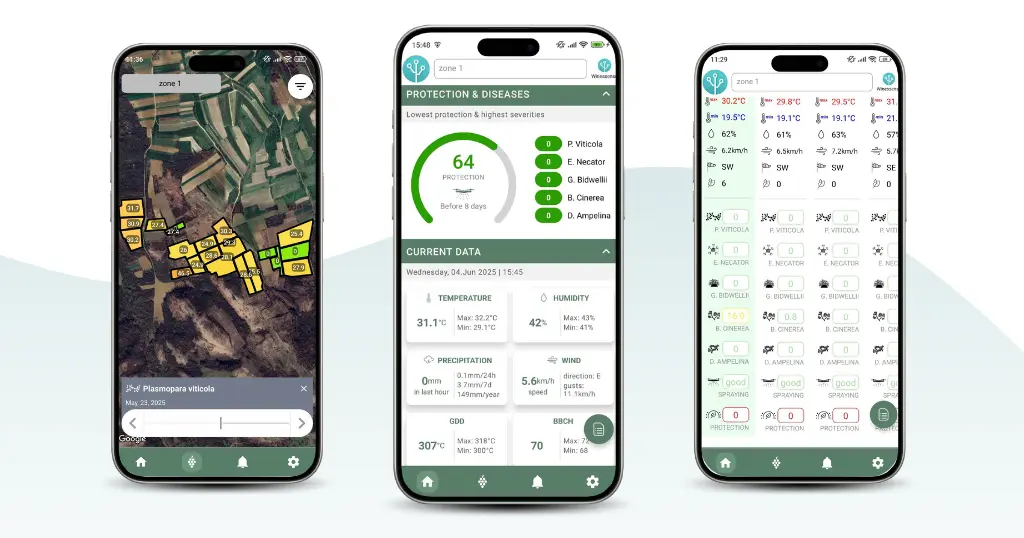
Anyone can track the microclimate of each plot of a vineyard using the Winessense sensor network and vineyard management software, while also receiving precise forecasts and notifications for grape diseases. Now, that we have precise viticulture technologies, wine farms of various sizes may utilize them to track every square inch of their land in real time.
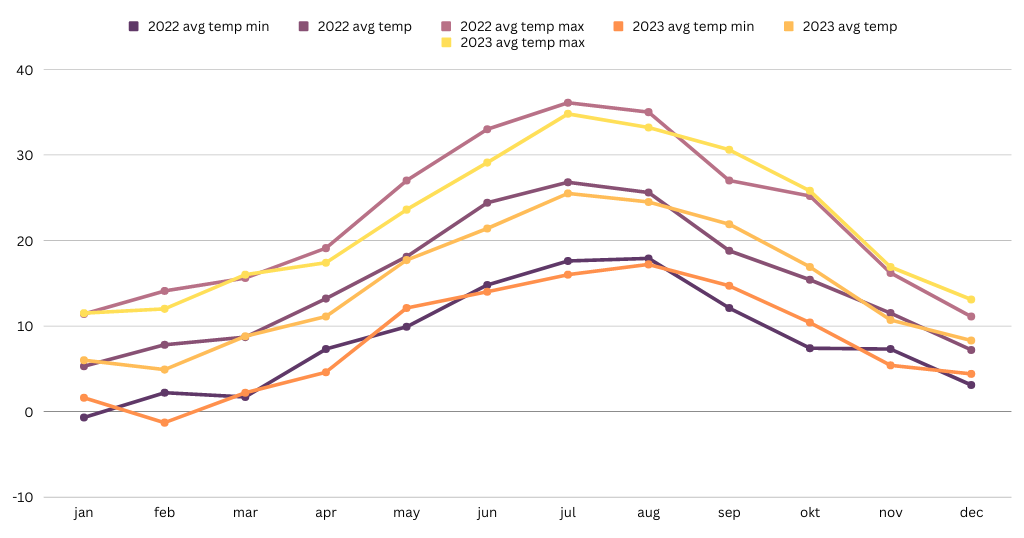
Full automation of the calculation of these indices is just one of the many benefits of agritech platforms like Winesense. Additionally, an ability to effortlessly compare seasonal differences on the same location through comparing calculated indices, and correlate that with different outcomes of seasons, is something that was not previously possible, at least not in a such a quick and simple way.